| Services - tools - models - for embedded software development |
|---|
| Services - tools - models - for embedded software development |
|---|

Application Note 7. Issue 1
March 2009
Copyright © 2009 Embecosm Limited
 | The document entitled " Integrating the GNU Debugger with Cycle Accurate Models " by Jeremy Bennett of Embecosm is licensed under a Creative Commons Attribution 2.0 UK: England & Wales License. See the Legal Notice for details. |
Table of Contents
This document describes how to integrate the GNU Debugger, GDB, with fast cycle accurate SystemC models of processors and systems-on-chip (SoC). This provides a highly productive environment for early software development, testing and performance analysis before silicon is available.
The interface is made through the cycle accurate model of the JTAG (IEEE 1149.1) interface of the chip [16] [15]. This means the interface is readily reusable for FPGA implementations or finished silicon.
Cycle accurate models in C and SystemC are becoming an increasingly important part of the verification process, particularly for SoCs with performance critical embedded software. They represent a software friendly compromise, offering higher performance than traditional event-driven simulation, but greater accuracy than hand-written instruction set simulators (ISS) and transaction level models (TLM).
Typically such models follow 2-state, zero-delay synthesis semantics, offering an early insight into the behavior of the synthesized design. Applications include:
Implementation of low level firmware, such as board support packages codecs and specialist device drivers, which rely on exact behavior of SoC peripherals.
Software optimization. This can be particularly important for codec development, where the performance depends critically on interaction between processor, memory, cache and MMU. In such scenarios, estimates by ISS and TLM can be out by a factor of 3, resulting either in wasted silicon, or chips that cannot meet their required performance.
Detailed performance analysis of systems, based on the actual hardware implementation running with its embedded software.
For all these purposes, a debugger is required, capable of communicating with the cycle accurate model. This application note shows how to implement that debugger interface for GDB using the GDB Remote Serial Protocol (RSP).
This application note builds on several earlier Embecosm Application notes:
EAN3. Howto: Porting the GNU Debugger: Practical Experience with the OpenRISC 1000 Architecture [7].
EAN4. Howto: GDB Remote Serial Protocol: Writing a RSP Server [8].
EAN5. Using JTAG with SystemC: Implementation of a Cycle Accurate Interface [9].
EAN6. High Performance SoC Modeling with Verilator: A Tutorial for Cycle Accurate SystemC Model Creation and Optimization [10].
This application note is intended for any engineer who needs to interface GDB to a cycle accurate model of a CPU or SoC. The earlier application notes provide guidance on GDB JTAG and cycle accurate modeling.
While based entirely on open source tools, the techniques described are equally applicable to commercial tools.
This application note uses entirely free and open source tools. The designed used is an open source SoC, ORPSoC [18]. The cycle accurate model is implemented in SystemC [22] generated automatically by Verilator [19]. The embedded software is compiled using the GNU C compiler [20] and debugged using the GNU debugger [21].
First and foremost this application note draws on techniques described in Embecosm Application Notes 3-6 [7] [8] [9] [10]. These should be used as the primary source of additional information.
Verilator has its own website (www.veripool.org), providing guidance for downloading, installing and using the tool. In particular this application note should be read in conjunction with the Verilator user guide.
SystemC is defined by IEEE standard 1666, and the standardization documents are the ultimate reference. The SystemC standard [14] is a free PDF download (a novelty for the IEEE). The open source reference implementation from OSCI includes an introductory tutorial.
JTAG is also an IEEE standard (1149.1), and the standardization document is the ultimate reference. Unlike the SystemC standard, the JTAG standard [16] costs money. The Texas Instruments JTAG primer [15] is a useful free alternative.
The main user guide for GDB [21] provides a great deal of context about how GDB is intended to work. The GDB Internals document [12] is essential reading before and during any porting exercise. It is not complete, nor is it always up to date, but it provides the first place to look for explanation of what a particular function does.
The files making up the examples used in this application noted are comprehensively commented, and can be processed with Doxygen [23]. Each class, member and method's behavior, parameters and return value is described.
There is a wealth of material to support both SystemC and JTAG on the Internet.
The Open SystemC Initiative (OSCI) provides an open source reference implementation of the SystemC library, which includes tutorial material in its documentation directory. These may be accessed from the OSCI website (www.systemc.org).
OSCI also provide a number of public mailing lists. The help forum and the community forum are of particular relevance. Subscription is through the OSCI website (see above).
The main GDB website is at sourceware.org/gdb/. It is supplemented by the less formal GDB Wiki at sourceware.org/gdb/wiki/.
The GDB developer community communicate through the GDB mailing lists and using IRC chat. These are always good places to find solutions to problems.
The main mailing list for discussion is gdb@sourceware.org, although for detailed understanding, the patches mailing list, gdb-patches@sourceware.org is useful. See the main GDB website for details of subscribing to these mailing lists.
IRC is on channel #gdb on
irc.freenode.net.
Embecosm is a consultancy specializing in open source tools, models and training for the embedded software community. All Embecosm products are freely available under open source licenses.
Embecosm offers a range of commercial services:
Customization of open source tools and software, including porting to new architectures.
Support, tutorials and training for open source tools and software.
Custom software development for the embedded market, including bespoke software models of hardware.
Independent evaluation of software tools.
For further information, visit the Embecosm website at www.embecosm.com.
The development of SystemC as a standard for modeling hardware started in 1996. Version 2.0 of the proposed standard was released by the Open SystemC Initiative (OSCI) in 2002. In 2006, SystemC became IEEE standard 1666-2005 [14].
Most software languages are not particularly suited to modeling hardware systems[1]. SystemC was developed to provide features that facilitate hardware modeling, in particular to model the parallelism of hardware, in a mainstream programming language.
An important objective was that software engineers should be comfortable with using SystemC, even though it is a hardware modeling language. Rather than invent a new language, SystemC is based on the existing C++ language. SystemC is a true super-set of C++, so any C++ program is automatically a valid SystemC program.
SystemC uses the template, macro and library features of C++ to extend the language. The key features it provides are:
A C++ class, sc_module, suitable for
defining hardware modules containing parallel
processes.
![[Note]](./images/note.png) | Note |
|---|---|
Process is a general term in SystemC to describe the various ways of representing parallel flows of control. It has nothing to do with processes in the Linux or Microsoft Windows operating systems. |
A mechanism to define functions modeling the parallel
threads of control within sc_module
classes;
Two classes, sc_port and
sc_export to represent points of
connection to and from a sc_module;
A class, sc_interface to describe the
software services required by a sc_port
or provided by a sc_export;
A class, sc_prim_channel to represent the
channel connecting ports;
A set of derived classes, of
sc_prim_channel,
sc_interface,
sc_port and
sc_export to represent and connect common
channel types used in hardware design such as signals, buffers and
FIFOs; and
A comprehensive set of types to represent data in both 2-state and 4-state logic.
The full specification is 441 pages long [14]. The OSCI reference distribution includes a very useful introductory user guide and tutorial [22].
Cycle accurate models provide an accurate description of the state of the model on each clock cycle. As such they represent a mid-point between traditional event driven simulation (providing detail within the clock cycle) and high level transaction models (providing details of bus transactions, but usually only approximate estimates of the cycle count).
Cycle accurate models are of particular value, because they reflect the level of detail seen by a software engineer using a chip. The software engineer generally cannot see what is happening within clock cycles.
There is some variation in the level of detail shown with specific modeling techniques. For example cycle accurate models generated by ARC VTOC from Verilog RTL will show the value of every state holding register in the model on each clock edge, and any asynchronous signal edge. Hand-written cycle accurate models within ARM SoC Designer will typically only show the state on the active edge of the clock cycle, and that state will be restricted to the external ports and defined internal registers.
Most cycle accurate models follow 2-state, zero delay synthesis semantics. In this way they are closer to the behavior of the actual chip than traditional 4-state event-driven simulation. However there is no absolute reason why cycle-accurate models could not follow 4-state simulation semantics.
Some cycle accurate models are written by hand—for example the cycle accurate models supplied by ARM for their processor cores. However the great majority of cycle accurate models are generated automatically from Verilog or VHDL RTL. There are two commercial products (ARC VTOC and Carbon Design Systems ModelStudio) and one free open source product (Verilator).
These models typically follow 2-state, zero delay, synthesizable semantics. Embecosm Application Note 6 High Performance SoC Modeling with Verilator: A Tutorial for Cycle Accurate SystemC Model Creation and Optimization [10] describes how to created a Verilator SystemC model of ORPSoC which simulates at up to 130kHz on a standard Linux PC.
All these tools generate models in C/C++. However SystemC is becoming increasingly popular, and is generated by all the tools as well. However the reference OSCI SystemC simulator carries a serious performance penalty, and in all cases the model is a SystemC wrapper for the top level ports around a plain C/C++ model.
The performance penalty of SystemC wrappers should be a consideration when generating cycle accurate models. Performance can be particularly adversely affected by any ports of wider than 64-bits. The reference SystemC simulator has a very low-performance implementation of such ports.
The OpenRISC 1000 project forms part of the OpenCores organization (www.opencores.org). Its aim is to create a free open source computing platform, comprising:
An open source 32/64 bit RISC/DSP architecture;
A set of open source implementations of the architecture; and
A complete open source tool chain and operating system.
The OpenRISC 1000 project has resulted in Verilog for a 32-bit processor core, the OpenRISC 1200 (sometimes known as OR1200) and a complete reference System on Chip (SoC) design using that core, ORPSoC.
OpenRISC 1000 is a traditional RISC load-store architecture. Optional operands for multiplication and division may be added and there are optional data and instruction caches and MMUs.
A particularly useful feature is the l.nop
opcode. This takes an optional 16-bit constant operand, which is
placed in the low 16-bits of the instruction word. This field has no
impact on the execution of the instruction, but may be analyzed as
required by external test benches.
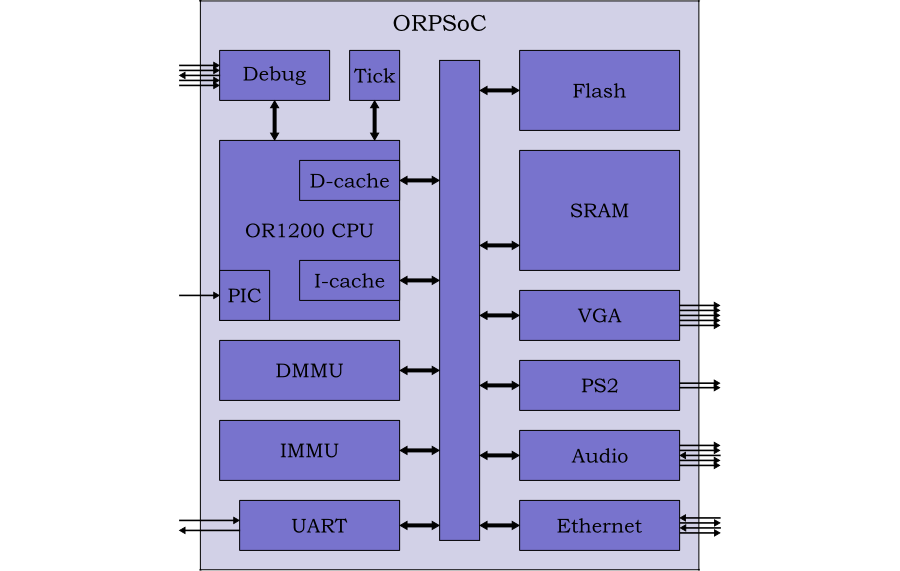
ORPSoC is a complete SoC based on the OpenRISC 1000. It combines the processor with SRAM, flash memory and a range of peripherals as shown in Figure 2.1.
The full design is around 150k gates + memories. It runs on standard Altera and Xilinx FPGA boards and is also available commercially from Flextronics.
[1] There are some exceptions, most notably Simula67, one of the languages which inspired C++. In some respects it is remarkably like SystemC.
The demonstration system is based on a fully configured ORPSoC with data and instruction caches, data and instruction MMUs, multiply and divide instructions, 2MB Flash and 2MB SRAM. SRAM and all other memories are implemented as generic flip-flop memory. Flash memory is modeled as generic SRAM initialized from a file. The architecture of ORPSoC was shown earlier in Figure 2.1.
A cycle accurate SystemC model of ORPSoC is generated using Verilator. The creation of this model is described in Embecosm Application Note 6 [10].
With the exception of JTAG (see Section 3.1), none of the peripherals is modeled—all external ports are tied off to appropriate values.
The system clock is set at 10 MHz (clock period 100 ns). This is an arbitrary choice, but makes for easy reading of VCD traces. Modern FPGAs are capable of running ORPSoC at around 30 MHz.
The five JTAG ports in ORPSoC are modeled as SystemC
sc_in<bool> (for jtag_tck,
jtag_tdi, jtag_tms and
jtag_trst) and sc_in<bool> ports
(for jtag_tdo).
Rather than drive the JTAG ports directly, requiring detailed management of the Test Access Port (TAP) state machine, the GDB interface uses the Embecosm cycle accurate SystemC JTAG interface [9]. This provides a SystemC FIFO interface on which requests to read and write the JTAG instruction and data registers can be queued, as well as requests to reset the JTAG TAP state machine.
The ORPSoC model is designed to load an initial image into Flash
memory at start up. When debugging with GDB it is more usual to use
the debugger to load a particular image into RAM. So the initial flash
image is just a simple program which initializes the caches, then sits
in a tight loop. It may be found in the sw/loop
directory and makes use of the OpenRISC 1000 utilities in
sw/utils and the library in
sw/support.
The directory sw/test-progs contains a series of
programs for loading into RAM by GDB. The programs are:
hello.c. A simple "Hello World" program.
The distribution includes a top level make file, which will build
the target model and link it to the GDB RSP server
interface. Plain make will build an unoptimized
server and model. Using make run-fast will
build a model with profile-based optimization (which can increase
performance by a factor of 3). Using
make VFLAGS=-trace will build an unoptimized
version of the server and model which also generates a VCD dump of
the model in v-dump.vcd (and consequently runs
many times slower).
The build process assumes the availability of packages from other
Embecosm packages. In particular the Embecosm Cycle Accurate SystemC
interface [9] is assumed to be installed
in /opt/ca-sysc-jtag and the Cycle Accurate
SystemC Model generated using Verilator [10] is assumed to be in a peer directory named
or1k-verilator. Alternative locations may be used
by editing the top level Makefile.
A number of additional parameters are available, which mirror the parameters described in Embecosm Application Note 6, High Performance SoC Modeling with Verilator: A Tutorial for Cycle Accurate SystemC Model Creation and Optimization [10].
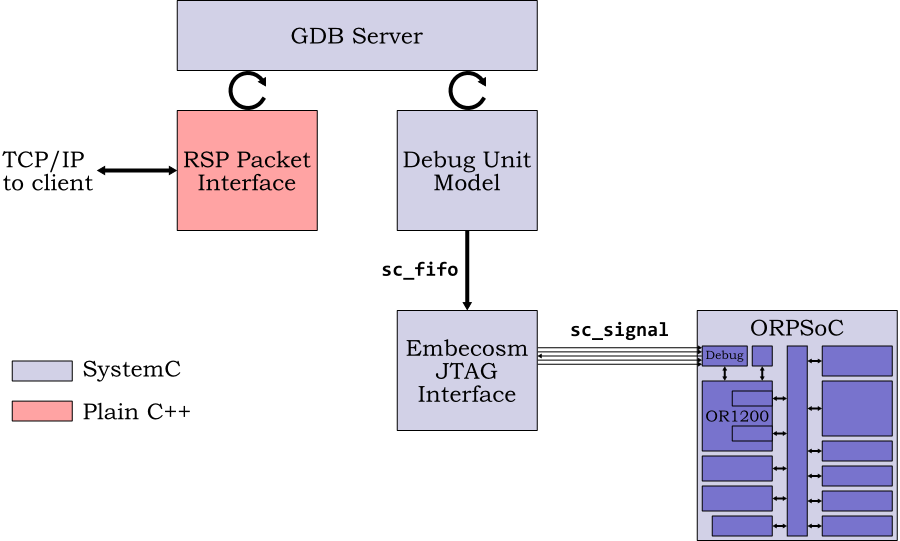
The overall structure of the system is shown in Figure 4.1.
The top level SystemC module is the GDB Server. This relies on the RSP packet interface to communicate over TCP/IP with the GDB client. It uses a model of the OpenRISC 1000 Debug Unit to talk to the cycle accurate model of ORPSoC. The Debug Unit in turn uses the Embecosm JTAG interface, allowing it to keep its JTAG interactions at a high level.
The model side is implemented in SystemC, the RSP interface in plain C++.
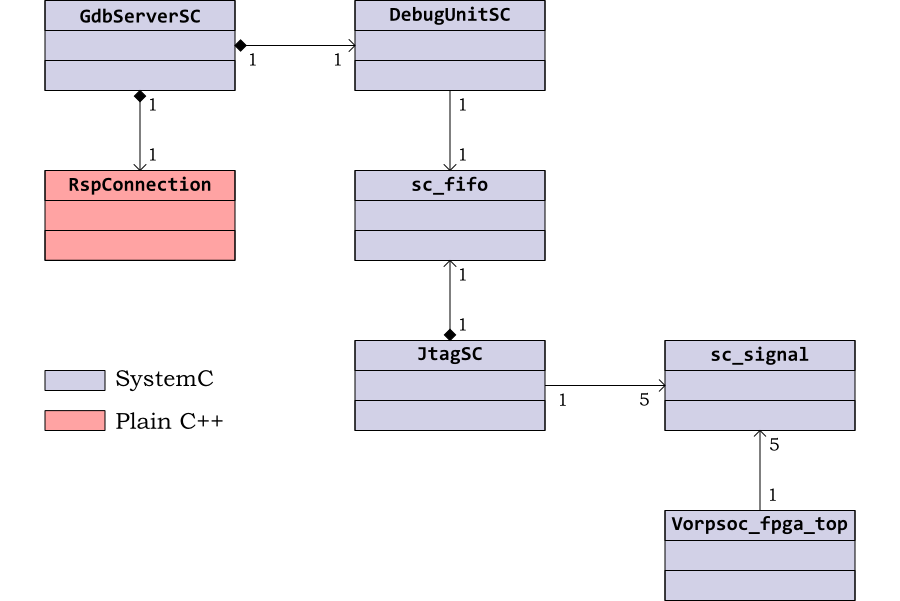
This structure is reflected in the top level class diagram, shown in
Figure 4.2. The SystemC classes are C++
classes which have sc_module as a base
class. By convention SystemC classes have the suffix
SC and Verilator generated model classes have the
prefix V followed by the name of the top level
Verilog module.
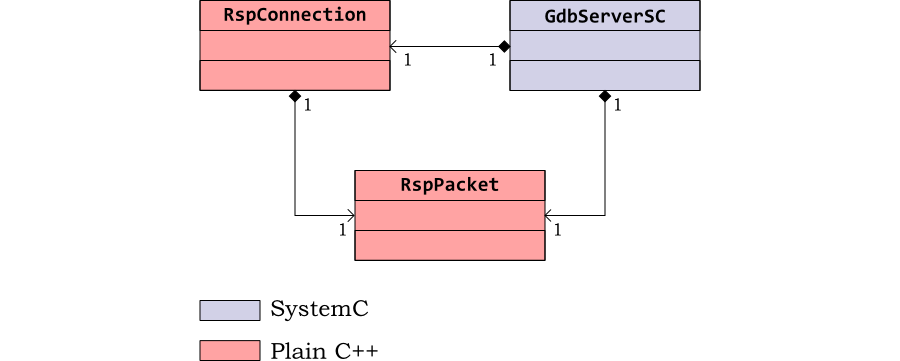
The RSP packet interface is responsible for establishing the
TCP/IP connection to and from the GDB server class,
GdbServerSC and transferring RSP packets to
and from the server. Packets are represented by their own class,
RspPacket.
The class diagram in Figure 4.3 shows the relationship between these components.
The main GdbServerSC class is responsible for
creating both the RspConnection instance and
the RspPacket instance. In the RSP protocol
there is only ever one packet active at any time, so a single instance
suffices. It is passed by pointer to
RspConnection for use when getting and putting
packets on the TCP/IP connection.
The RSP connection is written in plain C++. There is no need for
SystemC functionality. Indeed the use of system library routines to
establish sockets and listen for new connections does not sit
comfortably within the SystemC paradigm. A wait
in the system library context suspends the entire process pending
action, whereas wait in the SystemC context
merely suspends the current thread.
This does not cause any practical problem with the synchronous GDB RSP interface. The TCP/IP connection is only used when the target is suspended, so there is no need for SystemC to be active.
The public interface to this class is as follows:
RspConnection. The constructor, provided in
two flavors. The first takes a single integer argument, the port
number to listen on. The second takes an optional string
argument, the name of a TCP/IP service to listen on (which
defaults to "or1ksim-rsp").
Both use the private function, rspInit to
save the port number (0 if the service name is to be used) and
service name and set the file descriptor for the connection
(private variable clientFd) to -1, indicating
no connection is present.
~RspConnection. The destructor, which
closes any connection which has been established.
rspConnect (). This function listens for
client GDB connections over TCP/IP using the port or service
specified in the constructor. The connection is established with
a keep-alive flag (for long debug sessions) and with Nagel's
algorithm disabled. This ensures that the characters of a packet
are transmitted as a soon as they are available, rather than
being grouped for more efficient transmission. This is
appropriate for an interactive interface such as a debugger.
Once a connection is established, its file descriptor (which
cannot be negative) is stored in the private variable,
clientFd.
The function returns false if a catastrophic
failure occurs in setting up the connection. This will cause the
GDB server to terminate. A result of true
indicates either a successful connection, or that the connection
attempt may be retried. The two can be distinguished by use of
the isConnected function (see below).
rspClose. This closes the connection if it
is open and sets the file descriptor
(clientFd) to -1. It may be safely called
without checking if the connection is still open, since it will
check the value of clientFd before closing
it.
isConnected. This returns
true if a connection is established
(i.e. clientFd is not negative) and
false otherwise.
getPkt. This takes a pointer to a packet
and populates it with the data from the next packet read from
the TCP/IP stream. It will continue to retry until a packet is
successfully read (i.e. is complete, fits into the packet data
structure and has a correct checksum) or the connection
fails. The packet is acknowledged back to the client.
The RSP protocol requires certain characters
('$', '#' and
'}') in the data field of incoming packets to
be escaped. However rather than inspecting every packet for
escaped characters, it is the raw data which is stored. This is
because there is only one packet type (X)
which can have these characters, and it is more efficient to
unescape the characters only in the handler for that packet.
The private function getRspChar is used to
read individual characters from the socket. It will
automatically retry in the event of an interrupt.
The function returns true if a packet is
successfully read and false if the connection
fails.
putPkt. This is the complement to
getPkt, sending its argument packet back to
the client. It will continue to retry until receipt is
successfully acknowledged or the connection fails.
Unlike getPkt, putPkt
escapes its data field. Characters '$',
'#', '*' and
'}' are escaped by preceding them with
'}' and then the original character XORed
with 0x20. It makes sense to centralize escaping here, since
several commands may generate results using these characters.
The private function putRspChar is used to
write individual characters to the socket. It will automatically
retry in the event of an interrupt.
The function returns true if a packet is
successfully sent and false if the connection
fails.
The RSP packet cannot be represented as a simple string, since binary packets may contain null (string terminator) characters. Instead the packet is represented as a character buffer and separate length field. However by convention the character buffer is also null-terminated, allowing non-binary packets to be printed out for debugging purposes. The public interface to this class is as follows:
RspPacket. The constructor takes a single
integer argument, the size of the data buffer to allocate. It
allocates that buffer and stores the record of its size.
~RspPacket. The destructor deletes the
allocated data buffer.
data. A pointer to the data buffer.
packStr. Takes a string constant as
argument and packs it into the data buffer, setting the length
field to the length of the string.
getBufSize, getLen and
setLen. Accessor functions to get the size
of the data buffer and to get and set the length of the data
currently stored there.
| Note |
|---|---|
Although by convention all data is stored null-terminated in the buffer, this null-termination is a convenience for debugging the GDB server and does not form part of the data. The length does not include this null-termination character. |
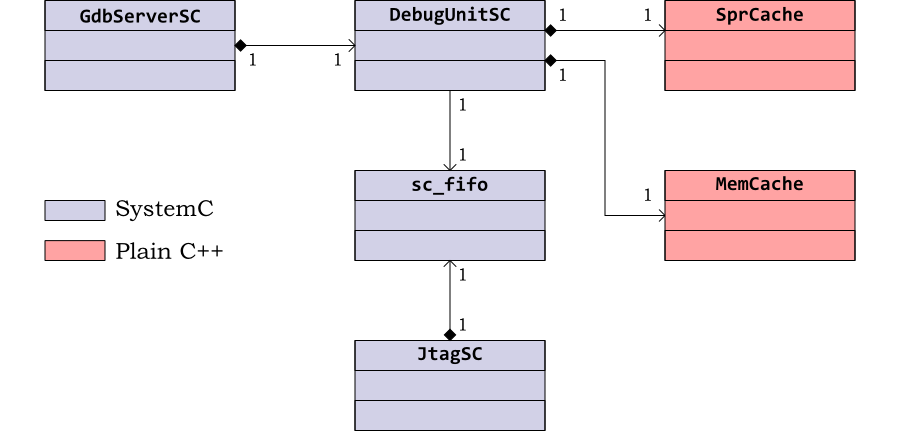
The OpenRISC 1000 Debug Unit model provides a higher level abstraction of the debug interface to the OpenRISC 1000, and sits above the JTAG interface. It allows access to main memory and special purpose registers (SPRs) together with control of the CPU reset and stall lines. These are all mapped onto lower level JTAG register accesses using the Embecosm cycle accurate SystemC JTAG interface.
The Debug Unit model also offers higher level caching functions. The JTAG clock typically has a period ten times greater than the main system clock. Combined with the serial nature of JTAG this means that accessing a single register or memory location can take many hundreds of system clock cycles.
While the processor is stalled, registers and memories do not change,
so caching is possible and can greatly increase performance. This is
provided through the SprCache and
MemCache classes.
The class diagram in Figure 4.4 shows the relationship between these components.
The main GdbServerSC class is responsible for
creating the DebugUnitSC instance, passing in the
SystemC FIFO used to connect to the SystemC JTAG
interface. The Debug Unit in turn instantiates the
SprCache and MemCache
instances.
| Note |
|---|---|
There are at least two different variants of the OpenRISC 1000 Debug Unit. This application note describes the version used within the OpenRISC 1000 Reference Platform System-on-Chip (ORPSoC). An alternative implementation by Igor Mohor is simpler and more recent. Where the two need to be distinguished, they will be referred to as the ORPSoC Debug Unit and Mohor Debug Unit respectively. Where not thus qualified, the ORPSoC Debug Unit is the implementation being referred to. |
The OpenRISC 1000 debug unit uses a 4-bit JTAG instruction register. It
adds two additional instructions, CHAIN_SELECT
(binary 0011) and DEBUG (binary 1000).
When instruction CHAIN_SELECT is used, the
subsequent value shifted into the JTAG data register indicates
the debug chain (see the section called “
JTAG Debug Chains
”) that
will be used for subsequent debug operations.
When instruction DEBUG is used,
subsequent values shifted into the JTAG data register are
interpreted as instructions for the debug chain selected by the
most recent CHAIN_SELECT instruction. 4 bits
are used to specify the debug chain.
All data registers have a cyclic redundancy check (CRC) field as their final (most significant) 8-bits, calculated on the remaining bits. The CRC used is the 8-bit ATM Header Error Correction [3], using the irreducible polynomial x8 + x2 + x + 1. This is capable of detecting all single and double bit errors in the data register and single burst errors of up to 8 bits.
So the usual sequence of operations is as follows:
Shift instruction register CHAIN_SELECT.
Shift data register with the desired debug chain (4 bits) + CRC (8 bits).
Shift instruction register DEBUG.
Shift the instructions appropriate to the selected debug chain in to the data register. The number of bits depends on the chosen debug chain (see the section called “ JTAG Debug Chains ”).
The debug chain is a 4-bit field. The OpenRISC 1000 Debug Unit defines 6 scan chains:
GLOBAL_BS (binary 0000). The default
debug chain, selected on reset, with no functionality.
RISC_DEBUG (binary 0001). The data
register is used to read and write Special Purpose Registers
(SPRs). It is described in more detail in the section called “
The RISC_DEBUG Debug Chain
”.
RISC_TEST (binary 0010). This debug
chain is specified, but not used. It has no functionality if
selected.
TRACE_TEST (binary 0011). This is
optionally available for the Debug Unit (under control of a
Verilog `define), offering hardware trace
functionality. It is not described further in this application
note.
REGISTER (binary 0100). The data register
is used to access and set the CPU's control registers. It is
described in more detail in the section called “
The REGISTER Debug Chain
”.
WISHBONE (binary 0101). The data
register is used to read and write main memory attached to the
Wishbone bus. It is described in more detail in the section called “
The WISHBONE Debug Chain
”.
The RISC_DEBUG chain uses a 73-bit data
register as shown in Figure 4.5.
The first 32 bits (SPR) specify the SPR to be accessed. Bit 32 (W) is set if the value is to be written. Bits 33-64 (Data) form the value to be written (if W is set) or the value read when the result is shifted out. The final 8 bits (65-72) are the CRC.
The CPU logic is fast enough that the data field can be set during a single JTAG capture-shift-update operation.
The REGISTER chain uses a 46-bit data
register as shown in Figure 4.6.
The first 5 bits (Reg) specify the CPU control register to be accessed. Bit 5 (W) is set if the value is to be written. Bits 6-37 (Data) form the value to be written (if W is set) or the value read when the result is shifted out. The final 8 bits (38-45) are the CRC.
The CPU logic is fast enough that the data field can be set during a single JTAG capture-shift-update operation.
The OpenRISC 1000 Debug Unit defines 6 CPU control registers:
MODER (binary 00000),
TSEL (binary 00001),
QSEL (binary 00010),
SSEL (binary 00011) and
RECSEL (binary 10000). These registers
control hardware trace, if that functionality is
implemented. They are not described further here.
RISCOP (binary 00100). The bits in this
register control the CPU. Bit 0 is the reset bit. If written
to 1, the CPU will be reset. Bit 1 is the stall bit. The value
read indicates whether the CPU is stalled. The CPU can be
stalled by writing 1 to this bit and unstalled by reading 0
from this bit.
![[Caution]](./images/caution.png) | Caution |
|---|---|
Remember that accessing a JTAG register takes hundreds of system clock cycles. It is quite possible to unstall the processor and for the processor to have stalled again (perhaps due to hardware single step, or an adjacent breakpoint) before the register is next read. This can cause confusion, with "unstalling" appearing to have no effect. A VCD trace always clarifies what is happening. |
| Note |
|---|---|
The Mohor Debug Unit has no support for trace and the value of
the Reg field is ignored. All accesses are for the
|
The WISHBONE chain uses a 73-bit data
register as shown in Figure 4.7.
The first 32 bits (Address) specify the memory address to be accessed. Bit 32 (W) is set if the value is to be written. Bits 33-64 (Data) form the value to be written (if W is set) or the value read when the result is shifted out. The final 8 bits (65-72) are the CRC.
The Wishbone memory interface may not be able to set the data
field during a single JTAG capture-shift-update operation. This
is particularly the case with slow memory. This can be solved
either by using the PAUSE-DR state of the
JTAG TAP state machine, or by performing two reads, one
immediately after the other.
This class is a SystemC module (i.e. it has
sc_module as a base class).
The Debug Unit functions work by queuing instances of
TapAction sub-classes on a queue (FIFO)
connected to the JTAG interface (class
JtagSC). This allows the debug unit to read
and write the various JTAG registers. In each case the debug unit
waits (using the SystemC wait function) for
notification that the action is complete before proceeding. The full
interface is described in Embecosm Application Note 5
Using JTAG with SystemC: Implementation of a Cycle
Accurate Interface [9].
The Debug Unit caches the current value of the debug chain. This means it can avoid selecting the chain for a debug action, where it is unchanged from the previous action.
The public interface to DebugUnitSC is as
follows:
DebugUnitSC. Constructor, which takes as
argument a pointer to the TAP action queue of the target
processor's JTAG interface.
The constructor instantiates the SPR and memory caches and marks the current stall state of the target as unknown and the current debug chain as undefined.
~DebugUnitSC. The destructor, which deletes
the SPR and memory caches.
resetDebugUnit. This function is called to
reset the JTAG interface (rather than the CPU). It achieves
this by queuing a TapActionReset
instance on the JTAG queue.
reset. This function resets the CPU. This is
achieved by selecting the REGISTER debug
chain and writing bit 1 of the RISCOP CPU
control register.
stall and unstall. These
stall and unstall the processor by selecting the
REGISTER debug chain and respectively setting
and clearing bit 0 of the RISCOP CPU control
register. As a matter of good practice the current value of the
register is read, the relevant bit changed and the value written
back. This ensures any other bits are unchanged.
In practice the only other bit that has any effect in the current implementation is bit-1 (the reset bit), which should always be clear in this circumstance. However using this approach ensures robustness of the code in the event of new control bits being added in future debug units. If performance was particularly critical, this function could be optimized by not reading the current value of the register.
isStalled. Return true if
the processor is currently stalled and false
otherwise.
The Debug Unit maintains a private enumeration variable
(stallState) tracking the stall state of the
processor. It is set to STALLED whenever the
processor is explicitly stalled (by using the
stall function) or is discovered to be
stalled. It is set to UNKNOWN whenever the
processor is explicitly unstalled, or found to be unstalled.
| Note |
|---|---|
A processor which is running (i.e. UNSTALLED) can at any time
stall, for example due to hitting a breakpoint. Hence the only
two useful values are |
If the StallState shows the processor is
currently stalled, the function immediately returns
TRUE. Otherwise it selects the REGISTER debug
chain and reads bit 0 of the RISCOP CPU
control register. It then sets StallState to
STALLED if the bit is set and
UNKNOWN if it is clear and returns
true if the state is stalled and
false otherwise.
readSpr and
writeSpr. These functions respectively read
and write a SPR by selecting the RISC_DEBUG
debug chain and shifting a data register with the SPR, W and
Data fields set appropriately.
This access can be optimized by use of the SPR cache. This is described in Section 5.2.
Almost all SPRs are readable. However the Next Program Counter (NPC) SPR has some unexpected behavior due to the operation of the processor pipeline, which must be managed. This is described in Section 4.6.1.
andSpr and orSpr. Most
SPR accesses involve reading a SPR using AND and OR
operations to clear or set a bit and then writing the value
back. These functions are provided as a convenience for such
operations. They just call the main readSpr
and writeSpr functions.
readMem32 and
writeMem32. These functions respectively
read and write a 32-bit value from memory attached to the
Wishbone bus of the OpenRISC 1000. The WISHBONE
debug chain is selected, and the value read or written by
shifting a data register with the Address, W and Data fields set
appropriately.
In the case of readMem32 the memory access
is usually not fast enough to populate the data out field in
time. The solution is either to use the JTAG
PAUSE-DR state after bit 32 has been shifted,
or to perform the read twice. The Embecosm Cycle Accurate
SystemC JTAG interface currently has no support for
mid-transfer use of PAUSE-DR, so in this
implementation reads are performed twice.
| Note |
|---|---|
The GDB client will work with target endianness for any data it accesses, so there is no need to make any transformation of data being transferred. |
| Caution |
|---|---|
Using GDB to read or write memory mapped device registers can be unreliable, particularly if reading has side effects (due to reads being performed twice). It is best avoided. |
readMem8 and
writeMem8. These functions respectively
read and write a single byte from memory attached to the
Wishbone bus of the OpenRISC 1000.
Since the Debug Unit only provides for 32-bit read and write,
the operation is achieved by using 32-bit access (using
readMem32 and
writeMem32) and selecting the relevant
byte. In the case of writing this requires reading the original
32-bit value, patching the relevant byte and writing back the
32-bit value.
Since the byte access will use host-endian arithmetic, the value
read must be converted from model endianness and any value
written must be converted back to model endianness. The
Utils class provides suitable static
functions to do this in Utils::mtohl and
Utils::htoml.
| Note |
|---|---|
Endianness is a compile time constant of the GDB
server. Either
This is conveniently set in the |
| Caution |
|---|---|
With the need for multiple accesses to 32-bit values for both read and write, using these functions to access memory mapped device registers is best avoided, particularly where registers (or any neighboring registers) have side-effects. |
The OpenRISC 1000 provides for up to 216 Special Purpose Registers (SPRs). These are frequently accessed to implement debugging commands, yet do not change when the CPU is stalled (but see the issue concerning the Next Program counter in Section 4.6.1).
In practice only a few SPRs are used repeatedly. It makes sense to
cache the SPRs in a simple closed hash table.
SprCache represents the cache as three
private C++ arrays. The Boolean array
sprIsvalid indicates whether than entry is valid,
the sprKeyNum array holds the SPR value for which
this entry is valid and sprValue holds the
corresponding cached value. Clearing the cache is a matter of
setting all entries in sprIsValid to
false using memset.
A key feature is that the Next Program Counter (NPC) must always be cached (see Section 4.6.1). The cache will reject attempts to write once it is 70% full (so caching remains efficient). However a flag may be used to force caching beyond this point. This is safe, because it is only ever used for one register, the NPC
The use of SprCache within the Debug Unit is
discussed in the chapter on optimization (Section 5.2).
The public interface to SprCache is as
follows:
SprCache. Constructor. Allocates the arrays
and calls clear to reset the cache.
~SprCache. Destructor. Deletes the arrays.
clear. Clears the cache by using
memset to set all entries in
sprIsValid to false.
write. Writes a value for a SPR into the
cache. Will do nothing if the cache is 70% full,
unless a flag parameter is set to force
caching (used for NPC).
read. Returns true if a
SPR is in the cache. The cached value is returned by reference
through the second argument.
It also make sense to cache memory accesses when the CPU is stalled. The same locations are repeatedly accessed as the stack is analyzed.
It is not generally feasible (nor efficient) to cache all of
memory. Instead a small hash table is used. In this case the hash
table is represented by three private arrays, each of the same size
(specified in the constructor and dynamically
allocated). tabIsValid is a Boolean array
indicating if the corresponding hash table slot is in
use. tabKeyAddr holds the memory address being
used to key a particular hash table
slot. tabValue holds the associated cached
value. The hash table can be cleared by using
memset to set all the elements of
tabIsValid to false.
The hash table provides for no retry function if a lookup clashes. The new key address replaces any existing entry. In practice clashes are very unlikely, so this makes lookup efficient.
The use of MemCache within the Debug Unit is
discussed in the chapter on optimization (Section 5.2).
The public interface to MemCache is as
follows:
MemCache. Constructor, which takes the size
of the hash table as an optional argument. The default if no
size is specified is 1009. The hash table arrays
(tabIsValid, tabKeyAddr
and tabValue) are allocated. The table is
cleared by calling clear.
~MemCache. The destructor, which frees the
hash table arrays.
clear. Clears the hash table by using
memset to set all elements of
tabIsValid to false.
write. Writes a hash table entry for a
specified address and value. Any existing entry at that location
is overwritten.
read. Returns true if
the given memory address is in the cache. The cached value is
returned by reference through the second argument.
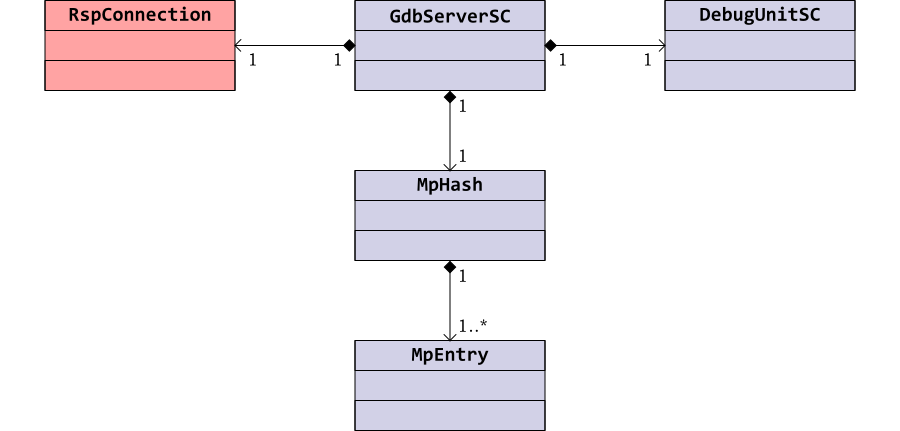
The class diagram in Figure 4.8 shows
the relationship between the main GdbServerSC
SystemC module class and other classes. The GDB server
instantiates a class, MpHash to track GDB
matchpoints (that is breakpoints and watchpoints) in a hash
table. MpHash is in turn built from instances
of MpEntry.
The public interface to the GdbServerSC class
is its constructor and destructor. The constructor arguments include
the start and end address of Flash memory, the port on which RSP
TCP/IP connections will be accepted and a pointer to the JTAG
FIFO for TAP actions.
The constructor instantiates a new instance of
RspConnection to handle the RSP TCP/IP
interface (see Section 4.2) and a new
instance of DebugUnitSC to model the interface
to the OpenRISC 1000 Debug Unit and drive the JTAG interface (see Section 4.3). It creates an instance of
RspPacket to hold the data associated with
the packet currently in use.
The GDB server needs to keep track of breakpoints and watchpoints
(collectively known as matchpoints) which have been
inserted. These use OpenRISC 1000 l.trap
instructions. Class MpHash holds details of
each matchpoint: its type, address and the instruction that was
replaced by l.trap. The
GdbServerSC constructor creates an instance
of this class.
Finally the constructor declares the private function
rspServer as a new SystemC THREAD.
On start up, the OpenRISC 1000 model loads an image from Flash memory which initializes the exception vectors in RAM, sets up any caches and then jumps to the reset vector (location 0x100). GDB debugging should not start until this initialization has occurred.
This is achieved by detecting when the processor first tries to access a location outside Flash memory (hence the need for this addresses to be passed to the constructor). At start up, the thread resets the JTAG interface of the Debug Unit, then waits until the next program counter has a value outside the flash memory address range.
This is followed by the main loop. The first part of the loop checks if a connection to a GDB client has been established, and if not loops trying to listen. When a new connection is established it immediately stalls the processor, pending instructions from the client.
The second part of the loop waits until the processor has stalled
(it will already be stalled on first connection). Once it has
stalled it notifies the GDB client, then processes the next
RSP packet from the client using the function
rspClientRequest. The majority of packets
will leave the CPU unstalled, so subsequent moves round the loop
will immediately come back to the same point and call
rspClientRequest again.
The exceptions are continue, step and restart packets which unstall the processor. There will be no further RSP packets processed until the processor stalls again. This will either be due to hitting a breakpoint or the connection being dropped and reconnected.
| Note |
|---|---|
This loop relies on detecting a stalled processor (using the
variable |
The processing of individual packets by
rspClientRequest follows the same approach
described in Embecosm Application Note 4 Howto: GDB
Remote Serial Protocol: Writing a RSP Server [8]. The only difference is the code is in
C++ rather than C. The details of individual packet actions are
not described further in this application note. All the actions
use reading and writing of SPRs and memory in the same
way. However for this application they use the functions provided
by the Debug Unit class, DebugUnitSC.
MpHash is a closed hash table, whose entries
are linked lists of MpEntry entities (see
Section 4.4.3). Each entry represents one
breakpoint or watchpoint. Five types of matchpoint are supported:
BP_MEMORYliteral>. A memory (soft)
breakpoint.
BP_HARDWARE. A hardware breakpoint
WP_WRITE. A hardware write watchpoint
WP_READ. A hardware read watchpoint
WP_ACCESS. A hardware access (read or write)
watchpoint.
Entries are keyed on both the address and type of the matchpoint. It is quite possible to have both a breakpoint and watchpoint on the same location, but they are separate entities.
| Note |
|---|---|
Although all five matchpoint types are supported in the matchpoint table, the current implementation of the GDB server does not provide an implementation for hardware breakpoints or any watchpoints. |
The public interface to MpHash is as follows:
MpHash. The constructor. Takes an optional
argument specifying the size of hash table to allocate (default
value 1021). Allocates a new array for the hash table in private
variable hashTab (an array of pointers to
MpEntry) and sets all the pointers to
NULL to mark the table as empty.
~MpHash. Destructor. Deletes the allocated
hash table.
add. Adds a new entry to the hash table if
it isn't already there. If it is there already it does nothing.
lookup. Look for an entry in the hash
table. If the entry is found, return a pointer to its
MpEntry, if not return
NULL.
remove. Remove an entry from the hash
table. Return true if the entry was found and
deleted, false otherwise.
MpEntry is declared as a struct, rather
than a class, to emphasize it is purely a data structure, with no
explicit member functions. It represents a single matchpoint in the
hash table.
There are three public member variables:
type. The type of matchpoint being
represented.
addr. The address of the matchpoint
instr. For memory (soft) breakpoints the
OpenRISC 1000 instruction which has been substituted by a
l.trap instruction.
There is one private variable, next, a pointer to
MpEntry, used to form lists of entries in
the hash table. MpHash is declared a friend
class, giving it access to this variable to construct the lists.
The main program is found in OrpsocMain.cpp, with
a header file, OrpsocMain.h, providing system
wide constants.
Since this is SystemC, OrpsocMain.cpp declares
sc_main. This instantiates all the SystemC
modules and connects them as described in Embecosm Application Note 6
High Performance SoC Modeling with Verilator: A Tutorial
for Cycle Accurate SystemC Model Creation and Optimization
[10]. The Embecosm Cycle Accurate
SystemC JTAG interface is instantiated and connected as described
in Embecosm Application Note 5 Using JTAG with SystemC:
Implementation of a Cycle Accurate Interface [9].
The port number to connect on may be supplied as an argument to the
GDB server program (so will appear in argv). If
not provided it defaults to 51000.
Finally the GDB server SystemC module,
GdbServerSC is instantiated taking the port
number and pointer to the JTAG FIFO as arguments. The
GdbServerSC SystemC thread will then execute,
processing RSP packets and driving the OpenRISC 1000 model via its JTAG
interface.
The directory sw/test-progs contains a number
of simple test programs. Use the Makefile to
build these. The programs include a simple "Hello World" program in
hello.c, which compiles to the file
hello.
First build the GDB server. Use the command make from the top level directory.
$ make

<makefile output>

time -p ./Vorpsoc_fpga_top

             SystemC 2.2.0 --- May 16 2008 10:30:46
        Copyright (c) 1996-2006 by all Contributors
                    ALL RIGHTS RESERVED
Loading flash image from sim/src/flash.in
(orpsoc.v.uart_top) UART INFO: Data bus width is 32. Debug Interface present.

(orpsoc.v.uart_top) UART INFO: Doesn't have baudrate output

Listening for RSP on port 51000
In a separate window, change to the
sw/test-progs sub-directory and build the
example programs using make. Then start the
OpenRISC 1000 implementation of GDB (see Embecosm Application Note 2:
The OpenCores OpenRISC 1000 Simulator and Tool Chain:
Installation Guide [6] for
details of how to install the tool chain).
$ or32-uclinux-gdb
Building automata... done, num uncovered: 0/216.
Parsing operands data... done.
GNU gdb 6.8
Copyright (C) 2008 Free Software Foundation, Inc.
License GPLv3+: GNU GPL version 3 or later <http://gnu.org/licenses/gpl.html>
This is free software: you are free to change and redistribute it.
There is NO WARRANTY, to the extent permitted by law.  Type "show copying"
and "show warranty" for details.
This GDB was configured as "--host=i686-pc-linux-gnu --target=or32-uclinux".
(gdb)
First load the program symbol table using the file command. Then connect to the GDB server using the target remote command. Since no port number was specified, the default 51000 will be used:
(gdb) file hello
Reading symbols from .../sw/test-progs/hello...done.
(gdb) target remote :51000
Remote debugging using :51000
0x040001f0 in ?? ()
(gdb)
At start up the processor is stalled, so it looks to the GDB
client as though the target has just hit a breakpoint at the address
of the Previous Program Counter (PPC). Since the processor stalled
just as it finished executing in Flash memory, the address of the
PPC is an address in Flash. That has nothing to do with the "Hello
World" program which will be loaded, and for which the symbol table
has already been loaded. So the GDB client cannot identify which
source code this location corresponds to and just reports it as
??.
The window with the GDB server acknowledges the connection:
Listening for RSP on port 51000
Remote debugging from host 0.0.0.0
Since this is a local connection the remote host is reported as 0.0.0.0.
The client can now load the hello world program. This will take a few seconds, even for a program as small as this, since each word has to be loaded over the model of JTAG, taking round 750 clock cycles. Even with a model running at nearly 100kHz this takes some time.
(gdb) load hello
Loading section .text, size 0x1350 lma 0x0
Loading section .rodata, size 0x1f lma 0x1350
Start address 0x100, load size 4975
Transfer rate: 323 bytes/sec, 236 bytes/write.
(gdb)
A breakpoint can be set on the main program and execution continued:
(gdb) break main
Breakpoint 1 at 0x12f4: file hello.c, line 26.
(gdb) continue
Continuing.

Breakpoint 1, main () at hello.c:26
26        simputs ("Hello World!\n");
(gdb) list
21      #include "utils.h"
22
23
24      main()
25      {
26        simputs ("Hello World!\n");
27        simputs ("The answer is ");
28        simputn (6 * 7);
29        simputs ("\n");
30        simexit (42);
(gdb)
Placing a breakpoint on simputs allows the
output generation to be followed:
(gdb) break simputs
Breakpoint 2 at 0x1234: file utils.c, line 105.
(gdb) c
Continuing.

Breakpoint 2, simputs (str=0x1350 "Hello World!\n") at utils.c:105
105       for( i = 0; str[i] != '\0' ; i++ ) {
(gdb) list
100      */
101     void  simputs( char *str )
102     {
103       int  i;
104
105       for( i = 0; str[i] != '\0' ; i++ ) {
106         simputc( (int)(str[i]) );
107       }
108
109     }       /* simputs() */
(gdb)
At this stage no characters have been output, but continuing again will cause the function to execute once:
(gdb) continue
Continuing.

Breakpoint 2, simputs (str=0x1350 "Hello World!\n") at utils.c:105
105       for( i = 0; str[i] != '\0' ; i++ ) {
(gdb)
Switching back to the server window, the first line of output can be seen:
Listening for RSP on port 51000
Remote debugging from host 0.0.0.0
Hello World!
The GDB extensions for OpenRISC 1000 are supported, so the info spr and spr commands are both available:
(gdb) info spr cpucfgr
SYS.CPUCFGR = SPR0_2 = 32 (0x20)
(gdb)
The CPU configuration register is showing that only the
ORBIS32 instruction set is currently supported.
Deleting all breakpoints the program will run to completion:
(gdb) delete
Delete all breakpoints? (y or n) y
(gdb) continue
Continuing.
Remote connection closed
(gdb)
The server window shows the program running to completion. In this
example hello.c calls
simexit which uses the OpenRISC 1000
l.nop 1 instruction to cause the simulation
to terminate.
Listening for RSP on port 51000
Remote debugging from host 0.0.0.0
Hello World!
The answer is 42
546960700.00 ns: Exiting (42)
SystemC: simulation stopped by user.
Closing connection
real 2708.49
user 87.82
sys 0.53
$
On completion the RSP connection is dropped.
Real hardware always has small issues which deviate from the standard documentation. Sometimes these are bugs, but on other occasions they represent subtleties of behavior which have not been fully documented. Any model generated automatically from Verilog RTL will always faithfully model these small details. The OpenRISC 1000 is no exception and the RTL includes examples of both classes of minor deviation from the documentation.
Any debug interface must take account of such variations, in order to ensure consistent behavior.
The OpenRISC 1000 instruction set architecture specifies two SPRs describing the program counter. The Previous Program Counter (PPC) represents the address of the instruction just completed. The Next Program Counter (NPC) represents the address of the instruction about to be executed.
However the OpenRISC 1000 is a pipelined processor with a 4/5 stage pipeline, so at any one time up to 4 instructions can be at some stage of execution. The pipeline stages are:
Instruction Fetch
Instruction Decode
Execute
Memory access (only for load/store instructions). Will stall the pipeline while the memory is accessed.
Write Back
The PPC represents the address of the instruction that has just completed the write back stage of the pipeline. The NPC represents the address of the instruction which is the next to reach the write back stage of the pipeline (which may be at an earlier phase than write back, if the pipeline is not currently full).
The problem comes if the NPC is written while the processor is stalled. This must cause a flush of the pipeline, so until the processor is unstalled there is no instruction anywhere in the pipeline waiting to be executed. Thus a subsequent read of the NPC will return zero, not the value just written.
This behavior can be seen by following a VCD trace through a
number of debug actions. This uses the "Hello World" example from
Section 4.5.1. The program is loaded and run to a
breakpoint set at the start of main (address
0x12f4).
(gdb) target remote :51000
(gdb) load hello
Loading section .text, size 0x1350 lma 0x0
Loading section .rodata, size 0x1f lma 0x1350
Start address 0x100, load size 4975
Transfer rate: 82 bytes/sec, 236 bytes/write.
(gdb) break main
Breakpoint 1 at 0x12f4: file hello.c, line 26.
(gdb) continue
Continuing.

Breakpoint 1, main () at hello.c:26
26        simputs ("Hello World!\n");
	  (gdb)
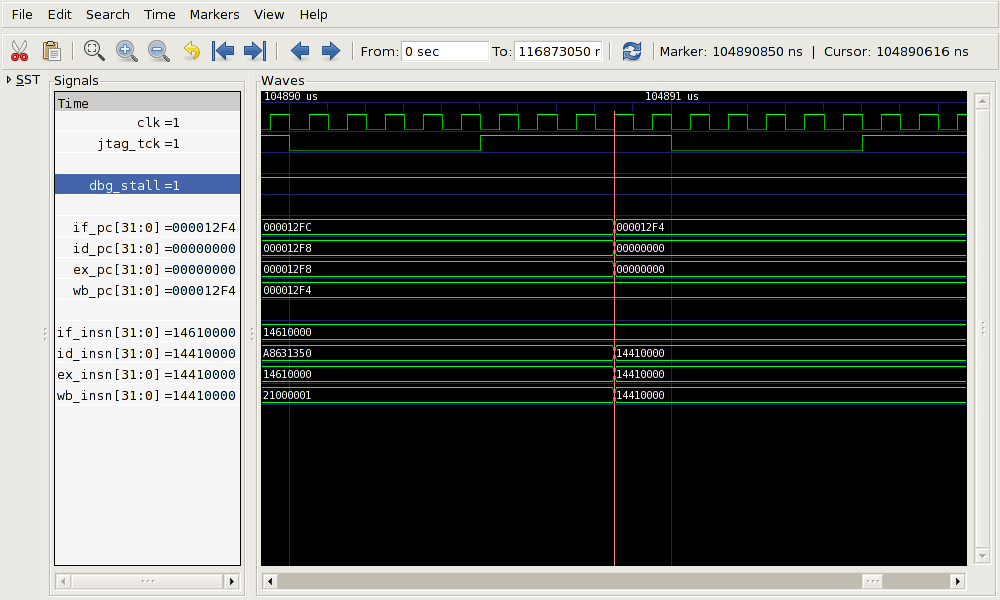
At this point (111,173.85μs), the wave trace in Figure 4.9 shows the processor stalling. The program
counter for the write back stage is the address of break point
(0x12f4) and the instruction associated with the write back phase is
the l.trap instruction (0x21000001) used to
generate the trap.
The succeeding instructions can be seen part processed in the pipeline. Disassembling around the breakpoint, the assembly code is:
(gdb) disassemble 0x12f0 0x1300
Dump of assembler code from 0x12f0 to 0x1300:
0x000012f0 <main+12>:   l.sw     0(r1),r9
0x000012f4 <main+16>:   l.movhi  r3,0x0
0x000012f8 <main+20>:   l.ori    r3,r3,0x1350
0x000012fc <main+24>:   l.jal    <simputs>
End of assembler dump.
(gdb)
The instruction at the breakpoint (0x12f4) is not
l.movhi as shown in the disassembly, but has been
replaced by the l.trap to cause the
breakpoint. The next instruction, at location 0x12f8 is
l.ori r3,r3,0x1350 (0xa8631350). This
instruction is between instruction decode and execution stages. The
address is shown in both stages and the instruction itself can be
seen in the instruction decode stage.
On hitting a breakpoint, the first action of GDB is to set the
program counter back by one instruction. This is because the
instruction that was replaced by l.trap for the
breakpoint must be put back so it can be executed before resuming
any further execution. This involves writing the NPC, changing it
from its value of 0x12f8 (the l.ori instruction)
back to 0x12f4.
This behavior can be seen in Figure 4.10 at time 104,890.85μs. The write back program counter is left unchanged (0x12f4), since the instruction has already been executed. However the program counters for instruction decode and execute are set to zero. The program counter for instruction fetch is set to the new value, 0x12f4. The instruction registers for all stages have nonsense values in them (there is no OpenRISC 1000 instruction beginning with 0x14).
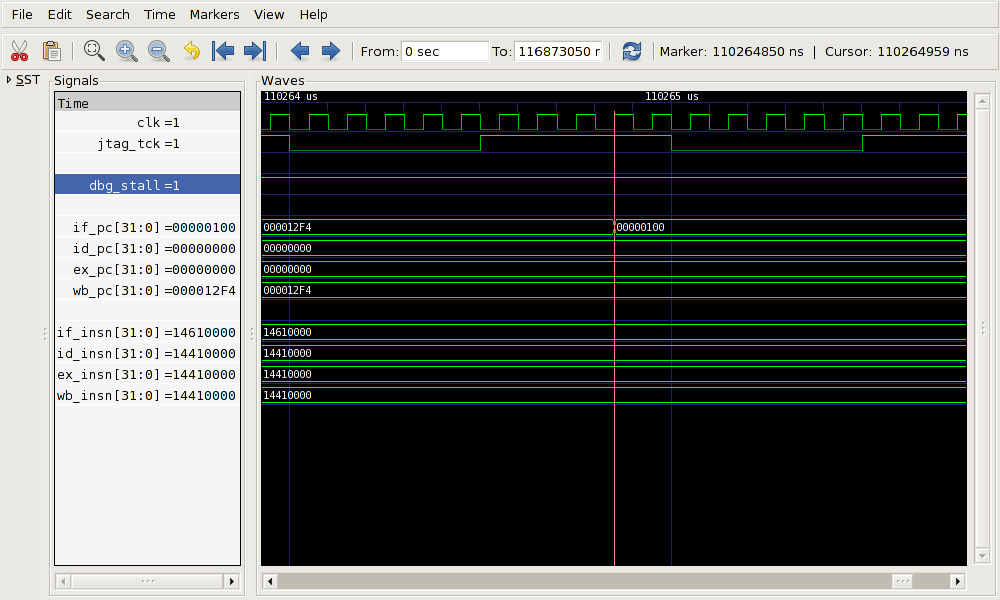
The Next Program Counter (NPC) is used in GDB as the value of the Program Counter ($pc). This can be changed using the set command:
(gdb) set $pc=0x100
(gdb)
The value appears as the new address for the instruction decode stage of the pipeline. This is shown in Figure 4.11 at time 110,264.85μs. Addresses for all other pipeline stages are unchanged, and the instruction values for these stages are still meaningless.
Once the pipeline is unstalled, it will refill. This can be achieved by continuing execution:
(gdb) continue
Continuing.

Breakpoint 1, main () at hello.c:26
26        simputs ("Hello World!\n");
(gdb)
Execution will restart from the new value of NPC (0x100, the reset vector). A disassembly shows the instructions at that address:
(gdb) disassemble 0x100 0x110
Dump of assembler code from 0x100 to 0x110:
0x00000100 <_start+0>:  l.addi   r1,r0,32512
0x00000104 <_start+4>:  l.addi   r2,r1,0
0x00000108 <_start+8>:  l.mfspr  r3,r0,0x11
0x0000010c <_start+12>: l.ori    r3,r3,0x2
End of assembler dump.
(gdb)
The VCD trace in Figure 4.12 shows
the processor unstalling at
time 111,173.85μs. In consecutive cycles the pipeline fills with
the instructions from locations 0x100 (0x9c207f00,
l.addi r1,r0,0x7f00, 0x104 (0x9c410000,
l.addi r2,r1,0), 0x108 (0xb4600011,
l.mfspr r3,r0,0x11) and 0x10c (0xa8630002,
l.ori r3,r3,0x2).
This complexity of behavior is not generally what is wanted by a debugger. GDB will regularly write the NPC to a new value, but expects that subsequent reads will return the value just written. It is therefore essential that notwithstanding any other arrangements the NPC must be cached while the processor is stalled.
GDB from time to time may write the NPC to its current value. The intention is that this should have no effect, yet if the NPC SPR is written the pipeline will be flushed. This can be particularly catastrophic if the flush causes a delayed branch to be lost.
Thus the interface must ensure that any request to write the value of the NPC does nothing if the value is the same as the value already there.
This appears to be a hardware bug. However there may be a good reason for the behavior, since it is quite explicit in the source Verilog.
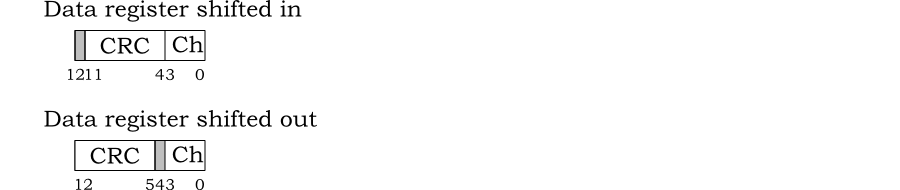
The JTAG data registers are all one bit bigger than stated in Section 4.3. When shifting a register in an extra top bit is provided, but ignored. When shifting the register out however the extra bit is provided before the CRC. This affects all data registers. The data register specifying the debug chain has the format in Figure 4.13.
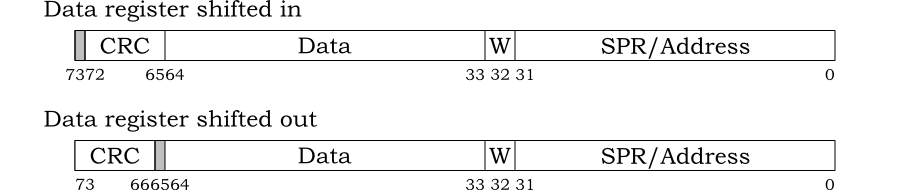
The formats of the data registers used with the
RISC_DEBUG and WISHBONE debug
chains are the same, as shown in Figure 4.14.
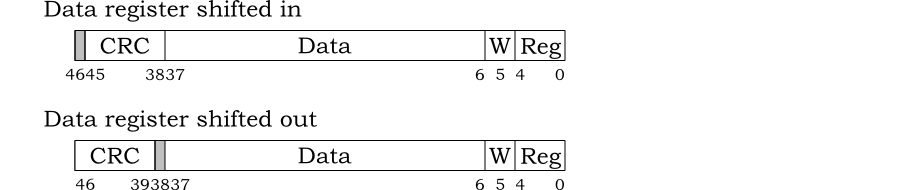
The format of the data register used with the
REGISTER debug
chain is shown in Figure 4.15.
This is a genuine bug in the interaction between Debug Unit and CPU. When hardware single step is used, the pipeline can become confused, leading to multiple executions of the same instruction, and eventually to the same instruction being executed forever.
Hardware single-step is always used in two places. First when
restarting after a breakpoint to execute the instruction that was
replaced by l.trap. GDB single steps the
instruction, then replaces it with l.trap, so the
breakpoint can be used again.
Secondly GDB uses single step for the stepi command.
A sequence of stepi commands illustrates the problem:
(gdb) si
0x00001224 in simputs (str=0x0) at utils.c:102
102     {
(gdb) si
0x00001228      102     {
(gdb) si
0x00001228      102     {
(gdb) si
0x0000122c      102     {
(gdb) si
0x00001230      102     {
(gdb) si
0x00001230      102     {
(gdb) si
0x00001230      102     {
(gdb) si
0x00001230      102     {
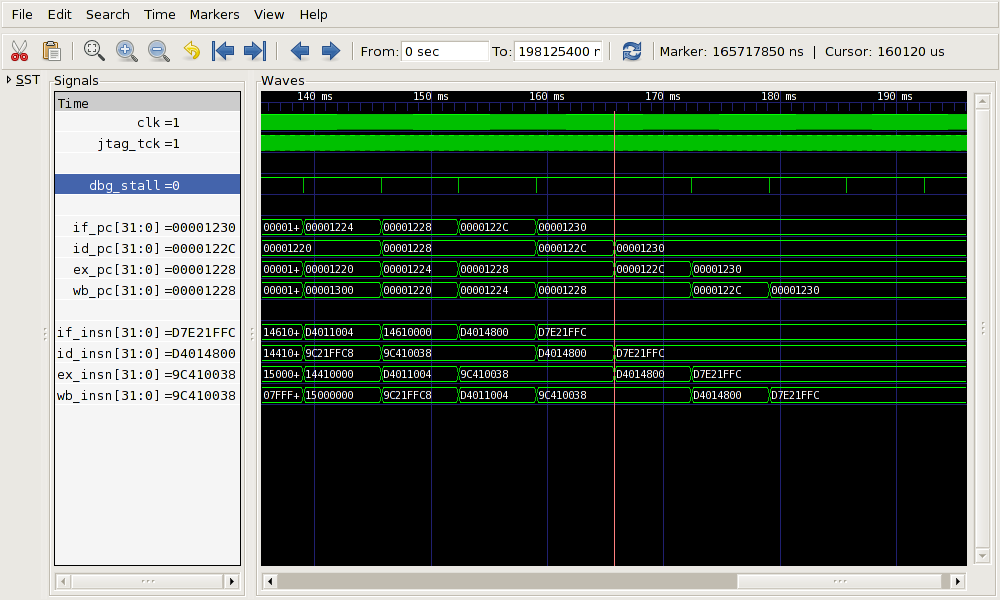
The VCD trace in Figure 4.16 shows the pipeline failing to fill correctly after some of the single steps
From around 140ms, the pipeline refill starts to go wrong. The ticks
on the dbg_stall line are the individual single
steps. By 180ms the pipeline is completely filled with the
instruction at address 0x1230 (0xd7e21ffc,
l.sw -4(r2),r3).
Unfortunately single stepping is sometimes used by GDB in other circumstances. For example a step (high level instruction step) or nextcommand> may use multiple steps rather than setting and running to a temporary breakpoint. Under these circumstances the GDB client will hang, because the target does not seem to reach its target.
There is a workaround, which is to use ctrl-C (twice) to break the connection and then reconnect. The OpenRISC 1000 is stalled at the time, so on reconnection will be at the same location. Using continue allows the pipeline to refill correctly.
(gdb) s
^C^CInterrupted while waiting for the program.
Give up (and stop debugging it)? (y or n) y
(gdb) target remote :51000
Remote debugging using :51000
0x00001230 in simputs (str=0x1350 "Hello World!\n") at utils.c:102
102     {
(gdb) c
Continuing.

Breakpoint 4, simputs (str=0x1350 "Hello World!\n") at utils.c:105
105       for( i = 0; str[i] != '\0' ; i++ ) {
(gdb)
The solution is to modify the handling of the RSP step (s)
packet, so that two consecutive hardware single-step operations
are never used. A second step is implemented using
l.trap.
This is not completely trivial, since the case where the second step would have occurred on a branch delay slot must be handled. Fortunately under this circumstance the single step bug does not seem to occur, so it is sufficient to permit a second single step in the case where that step occurs on a delay slot.
The example code distributed with this application note does not have this solution implemented. It is left as an exercise for the reader.
As noted earlier, any JTAG action takes many hundreds of system clock cycles. This is due to the serial nature of the protocol and the JTAG clock typically running ten times slower than the system clock.
There are thus two ways to improve performance:
Minimize the number of JTAG actions used.
Maximize the performance of the underlying cycle accurate model.
To test performance of the GDB server, a GDB script is used with a
small program (in sw/test-progs/perf.c) which
exercises the model by computing Ackermann's function [1] [2]. This
is driven by a GDB script in
sw/test-progs/gdb-script. This script sets a
breakpoint on the entry point to a, which computes
Ackermann's function. It then carries out the following tests:
Continues past the breakpoint 50 times. This tests the efficiency of running to a breakpoint.
Disassembles the function 5 times. This tests the efficiency of memory access.
Prints the CPU configuration register 10 times. This tests the efficiency of SPR access.
GDB is run in silent batch mode:
or32-uclinux-gdb -batch -batch-silent --command gdb-script
The output is completely suppressed, removing any client I/O overhead. To measure the client's speed of loading (a measure of both model and memory access efficiency), the "Hello World" program from Section 4.5.1 is loaded manually.
The raw load generated by the debugging script can be measured by
comparing the number of cycles taken using the script, with the
number of cycles taken when just loading the program and running to
completion. The results, using a server with no compiler
optimization (-O0) and no caching of memory or
SPRs (see Section 5.2) are shown in Table 5.1.
|
Run Description |
Cycles |
Time |
Performance |
|---|---|---|---|
|
No optimization, no cache, no debug script |
1,491,415 |
45.83 s |
33 kHz |
|
No optimization, no cache, with debug script |
12,593,861 |
374.02 s |
34 kHz |
Table 5.1. Load generated by the GDB debugging script.
As can be seen the debugging commands add over 11 million cycles to the server model in this baseline configuration.
When stalled, SPR and memory values cannot change. It therefore
makes sense to cache these values to eliminate JTAG activity on
duplicate accesses when stalled. The classes to provide this
functionality (SprCache and
MemCache) were described in Section 4.3.
Caching can be disabled when building the model by defining
NOCACHE on the command line or in
DebugUnit.h.
| Caution |
|---|---|
The Next Program Counter NPC is always cached for the reasons described above in Section 4.6.1. |
The effect of caching on server performance and client load times can be seen in Table 5.2. This compares the performance of an unoptimized server with and without caches.
|
Run Description |
Cycles |
Time |
Perf |
Load Rate |
|---|---|---|---|---|
|
No optimization, no cache |
12,593,861 |
374.02 s |
34 kHz |
161 bytes/s |
|
No optimization, with cache |
8,097,241 |
257.34 s |
31 kHz |
164 bytes/s |
Table 5.2. Effect of SPR and memory caches on GDB server and client performance.
The extra cycles due to the debugging load have been reduced by 4.5 million, just over 40%. The time taken to load a program is unchanged. The memory cache cannot help, since this is an initial load.
As was shown in Embecosm Application Note 6 High Performance SoC Modeling with Verilator: A Tutorial for Cycle Accurate SystemC Model Creation and Optimization [10], compiler optimization has a very significant impact on performance.
The effect of compiler optimizations can be seen in Table 5.3. This compares the performance
using no optimization, optimization using -Os (the
best for single pass optimization) and profile directed optimization
using -O3 and profile statistics from a debugging
run using the Ackermann's Function test program. To build a model
using profile directed optimization with optimization level
-O3 use the run-fast target of
the Makefile in the distribution.
make run-fast OPT=-O3
|
Run Description |
Cycles |
Time |
Perf |
Load Rate |
|---|---|---|---|---|
|
No optimization(-O0) |
8,097,241 |
257.34 s |
31 kHz |
164 bytes/s |
|
Single pass optimization (-Os) |
8,097,241 |
124.71 s |
65 kHz |
383 bytes/s |
|
Profile directed optimization (-O3) |
8,097,241 |
92.69 s |
87 kHz |
487 bytes/s |
Table 5.3. Effect of compiler optimization on GDB server and client performance.
Using a single optimization pass more than doubles performance of both the server and client load times. Using profile directed optimization almost trebles performance.
There is a performance overhead to the RSP interface. It involves adding the JTAG module, with a thread sensitive to each JTAG clock and the GDB server module to process all the packets.
Even with minimal debugging activity (just loading the program and running to completion), the fastest the Ackermann's function model would execute was 93 kHz. The same optimized model was used without the debug interface in Embecosm Application Note 6 and achieved 130 kHz.
This is an inescapable overhead. However it is independent of the size of the underlying model. It shows significantly with the OpenRISC 1000, because of the efficiency of the underlying processor model. With larger and more complex SoCs it would be a less significant overhead.
Optimization is essential to achieving good debugging performance.
Caching Memory and SPRs yielded a 40% improvement in the overhead of debugging.
Simple optimization with -Os more than doubled
performance.
Profile directed optimization nearly trebled performance.
Overall, combining caching and and profile directed optimization, server execution time fell from 374 s to 92 s, representing a four-fold improvement in performance.
This application note has shown how to build and optimize a GDB RSP interface to a cycle accurate model of a complete SoC in SystemC. The steps can be summarized as:
Implement an interface which can read and write RSP packets from and to TCP/IP
Implement a model for the target's debug interface, which generates JTAG register actions.
Implement the main GDB server class, which maps actions requested in RSP packets to the functionality of the debug interface.
Use caching to minimize the number of JTAG register actions
Use C++ compiler options to maximize the performance of the GDB server.
The result is a GDB interface to a cycle accurate SystemC model of a complete SoC, with a performance which makes low-level firmware development a quite feasible activity.
Suggestions for corrections or improvements are welcomed. Please contact
the author at jeremy.bennett@embecosm.com.
Hardware logic model which is based only on logic high and logic low (binary 0 and binary 1) values.
See also 4-state.
Hardware logic model which considers unknown (X)
and unproven (Z) values as well as logic high and
logic low (binary 0 and binary 1).
See also 2-state.
A description of the relationship between byte and word addressing on a computer architecture. In a big endian architecture, the least significant byte in a data word resides at the highest byte address (of the bytes in the word) in memory.
The alternative is little endian addressing.
See also little endian.
In an event driven simulator, the analysis of source Verilog to create an executable which will subsequently perform the simulation.
JTAG is the usual name used for the IEEE 1149.1 standard entitled Standard Test Access Port and Boundary-Scan Architecture for test access ports used for testing printed circuit boards and chips using boundary scan.
This standard allows external reading of state within the board or chip. It is thus a natural mechanism for debuggers to connect to embedded systems.
A description of the relationship between byte and word addressing on a computer architecture. In a little endian architecture, the least significant byte in a data word resides at the lowest byte address (of the bytes in the word) in memory.
The alternative is big endian addressing.
See also big endian.
The industry standardization body for SystemC
A silicon chip which includes one or more processor cores.
A set of libraries and macros, which extend the C++ programming language to facilitate modeling of hardware.
Standardized by the Open SystemC Initiative, who provide an open source reference implementation.
See also Open SystemC Initiative.
[1] Wilhelm Ackermann. Zum Hilbertschen Aufbau der reellen Zahlen Mathematische Annalen , 1928, 118-133. doi:10.1007/BF01459088.
[2] Ackermann function. Wikipedia entry. en.wikipedia.org/wiki/Ackermann_function.
[4] Clifford E Cummings. "full_case parallel_case", the Evil Twins of Verilog Synthesis. SNUG 1999 1999. www.sunburst-design.com/papers.
[5] Clifford E Cummings. Nonblocking Assignments in Verilog Synthesis, Coding Styles That Kill! SNUG 2000 2000. www.sunburst-design.com/papers.
[6] Embecosm Application Note 2. The OpenCores OpenRISC 1000 Simulator and Tool Chain: Installation Guide. Issue 3. Embecosm Limited, November 2008.
[7] Embecosm Application Note 3. Howto: Porting the GNU Debugger: Practical Experience with the OpenRISC 1000 Architecture. Issue 2. Embecosm Limited, November 2008.
[8] Embecosm Application Note 4. Howto: GDB Remote Serial Protocol: Writing a RSP Server. Issue 2. Embecosm Limited, November 2008.
[9] Embecosm Application Note 5. Using JTAG with SystemC: Implementation of a Cycle Accurate Interface. Issue 1. Embecosm Limited, January 2009.
[10] Embecosm Application Note 6. High Performance SoC Modeling with Verilator: A Tutorial for Cycle Accurate SystemC Model Creation and Optimization. Issue 1. Embecosm Limited, February 2009.
[11] Embecosm Software Package 4. Cycle Accurate SystemC JTAG Interface: Reference Implementation. Embecosm Limited, January 2009. Available for free download from the Embecosm website at www.embecosm.com .
[12] John Gillmore and Stan Shebbs. GDB Internals: A guide to the internals of the GNU debugger, issue 2. Cygnus Solutions 2006 . http://sourceware.org/gdb/current/onlinedocs/gdbint_toc.html
[13] GTKWave 3.1 Wave Analyzer User's Guide. February 2008. gtkwave.sourceforge.net/
[14] IEEE Standard SystemC® Language: Reference Manual. IEEE Computer Society 2005 . IEEE Std 1666™-2005. Available for free download from standards.ieee.org/getieee/1666/index.html .
[15] IEEE Std 1149.1 (JTAG) Testability: Primer. Texas Instruments Semiconductor Group 1997. Available for free download from the Texas Instruments website at focus.ti.com/lit/an/ssya002d/ssya002d.pdf .
[16] IEEE standard test access port and boundary-scan architecture IEEE Computer Society 2001 (reaffirmed 2008) . IEEE Std 1149.1™-2001 .
[17] Don Mills and Clifford E Cummings. RTL Coding Styles That Yield Simulation and Synthesis Mismatches SNUG 1999 1999. www.sunburst-design.com/papers.
[18] The OpenRISC Reference Platform System-on-Chip. Available for download from www.opencores.org
[19] Wilson Snyder. Verilator 3.700. January 2009. www.veripool.org/wiki/verilator
[20] Richard Stallman and the GCC Developer Community. Using the GNU Compiler Collection (GCC), Free Software Foundation 2008 . http://gcc.gnu.org/onlinedocs/gcc/
[21] Richard Stallman, Roland Pesch, Stan Shebbs, et al. Debugging with GDB: The GNU Source-Level Debugger, issue 9. Free Software Foundation 2008 . http://sourceware.org/gdb/current/onlinedocs/gdb_toc.html
[22] SystemC Version 2.0 User Guide. Open SystemC Initiative, 2002. Available for download from www.systemc.org
[23] Dimitri van Heesch. Doxygen: Source code documentation generator tool, 2008 . www.doxygen.org