

Measuring the health of the LLVM community
by Jeremy Bennett

I recently gave a short talk at EuroLLVM 2025 in Berlin, looking at the health of the LLVM community. Most open source communities have an aspiration to be supportive and welcoming. The LLVM Foundation is a little unusual in that its mission explicitly states that education and increasing diversity in the field of compilers are at the heart of its work. It is why I have always found LLVM meetings so enjoyable. I am really a GCC engineer at heart, yet the LLVM community has always welcomed me, and been supportive of my efforts with LLVM.
But to paraphrase Peter Drucker, “You cannot manage what you do not measure”. So how do we measure the health of the LLVM community. Fortunately the technology we use, allows us to see very easily what is going on. For example from GitHub we can measure how many commits there are in each release or each year.
git log --oneline --no-merges remotes/upstream/release/20.x \
        ^remotes/upstream/release/19.x | wc -l
git log --oneline --no-merges --since-as-filter="2024-01-01" \
        --until="2024-12-31" | wc -l
From this we see a community which over 25 years has seen healthy growth

(with the obvious caveat that the data for 2025 cover just the first 3 months of the year).
We can restrict our searches to parts of the code base, which allows us to see the activity in parts of the project. Here is the activity over all the releases in the various front ends.

For the first years of LLVM, it was just a backend project, relying on tools like GCC for its front end. In release 2.1, we see the addition of the Clang C/C++ front end, then from release 2.8 the LLVM source level debugger, then from release 3.1, the LLVM linker, lld, and finally the Fortran front end Flang, starting from release 11.
Similarly we can see the activity of the various backends.
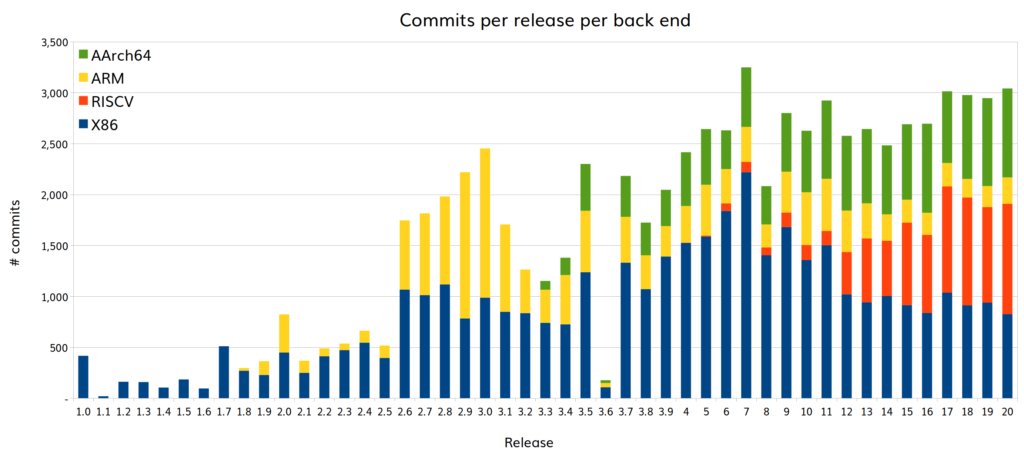
There are many backends, but four are dominant, Arm in its 32-bit and 64-bit (AArch64) variants, RISC-V and Intel x86. We can see a clear pattern here, backends are added, there is growth in activity as they mature, and then the activity levels off and eventually drops.
Git also allows us to see how active individuals are, but grouping commits by the name of the committer. And by examining domain names of committers’ email addresses, we can get a feel for the number of corporate entities who are contributing.
git log --no-merges remotes/upstream/release/20.x \
	  ^remotes/upstream/release/19.x \
        --pretty="format:%an" | sort -u | wc -l

git log --no-merges remotes/upstream/release/20.x \
        ^remotes/upstream/release/19.x \
        --pretty="format:%ae" | sed -e 's/^.\+@//' | sort -u
The second of these needs some post-processing to remove generic email domains (gmail, yahoo, hotmail etc), but then any domain that has more than one person contributing likely indicates a corporate commitment to the project. Looking at individual committers, we can see a steady growth over 25 years.
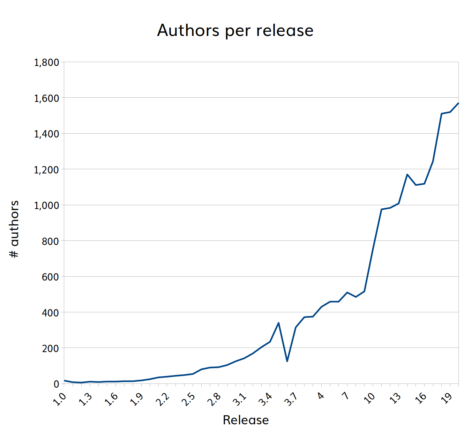
And the same is true for companies

We can look at the detailed data to gain more insights. It makes for an interesting transformation over time.
| Release 1.0 | Release 20 |
|---|---|
| 17 individual contributors | 1,571 individual contributors |
| 2 “corporate” email domains | 70 “corporate” email domains |
| 7 individuals committed more than once per week | 63 individuals committed more than once per week |
| Highest individual contribution: 6,511 commits | Highest individual contribution: 767 commits |
We can also compare LLVM to other projects, such as GCC, a subject I will come back to in a future post.
Because LLVM is now hosted on GitHub, we can use the GitHub API to delve further into the process by which individual commits are made. The following command will extract key fields from each pull request
gh pr list -L 1000000 -s closed \
           --json id,createdAt,closedAt,state,comments \
           -q '.. | .id?,.createdAt?,.closedAt?,.state?'
With a bit of post-processing we can extract the data to generate a graph of how many PRs go on to be accepted eventually, and how many are rejected.

The data is relatively new, since LLVM has only been using pull-requests for a couple of years. The good news is that the great majority of PRs are are accepted. But those PRs need reviewing, and we can process the data slightly differently to see how many review comments are needed before acceptance.
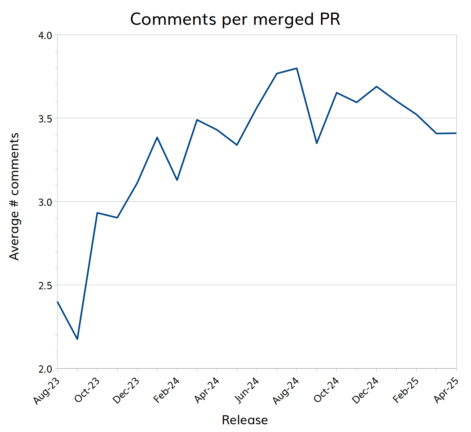
We can see that something over 3.5 comments are needed on average before a commit is accepted. Prior to 2023, LLVM used Phabricator to manage merge requests, and Phabricator recorded the same data for many years, showing consistently an average of 3.7 reviews before merge. This is a validation of the methodology, but more importantly shows the huge amount of work that engineers put in to review the work of their colleagues.
So far we have been able to demonstrate that the LLVM project from an engineering perspective is in rude good health. But how well is it doing in terms of diversity and inclusion. It turns out that we can use the same data to explore this question. For example we can infer the gender of contributors from their names, and use this to see what proportions of contributors are male, female, and how many choose monikers which hide their gender. We can look to see if gender affects how active a contributor is, the likelihood of their pull requests being accepted or how long they have stayed with the project.
I only briefly touched on this subject in my talk. It requires rigorous experimental design to ensure the results are meaningful and free from bias. But others have done a great deal of very valuable work. In my talk I drew attention to the work of Prof Andrea Capiluppi of the University of Groningen. He has published numerous papers on this subject over the years. His talk to the British Computer Society Open Source Specialist Group a decade ago provides an excellent introduction to the subject.
I hope my talk might inspire someone else to apply such methodologies to the LLVM community. Subjectively, I find it a welcoming and inclusive community. But it would be very useful to have a rigorous statistical analysis to confirm if that feeling really is correct.